Reading SOH

MarkHoward

Novice Member
Joined
Jun 3, 2024
Messages
9
Reaction score
3
Points
3
Age
75
Location
New Zealand
Driving
MG4 SE LR
Has anyone discovered a reliable way of reading the SOH in the MG4?
I have a VPeake ODB dongle.

Can't believe that MG has not provided this figure natively through the Infotainment system.
My Previous 7 years older BMW i3, did.
 
Whatever number you read is simply a calculation by the manufacturer anyway.

There's no way to measure SOH in any kind of standard comparable-across-makes way.

A number of people have read it via OBD2 scanners but it isn't clear what the number they get means and whether it is accurate.
 
To put some context around the variability of different manufacturer's "SOH" numbers:
  • Does it include the upper buffer? lower buffer? or without?
  • Is it relative to that specific battery's original capacity? (often >100% standard) or the manufacturer's standard? Or some average?
  • If the standard, which standard, since that changes with minor battery revisions from suppliers of the same model of battery and with re-testing/improved cell initialisation?
  • Is it calculated for a specific temperature? Which temperature? (since capacity is temperature-dependent).
  • Is it informed by cell voltage measurements? Or simply by a formula?
  • If it is a formula, is it by time (e.g. days), mileage, number of cycles or some combination?
  • Is the number a linear extrapolation or it is corrected by a curve?
etc... etc... etc...

It might be nice to know a number, but I am not sure it tells you much.

It would be useful to have a global standard and a standardised test / calibration.

In the meantime, what's more useful is to measure the actual capacity you're getting in miles.
 
As an example, Auto Trader tested a high mileage Model S (430k+ miles - some YT videos are linked elsewhere here) and one of the things they obtained was a battery report. Doing this via an app showed a SOH of about 75% ... doing the same via an "official" report showed about 72%. It's the same battery pack so which one is right? ?‍♂️
 
I just use the Car Scanner app figure as a reference, rather than a real figure, so I can see when it starts to drop.
FWIW, at my first service in June, the dealer reported my SOH as 99%, the app said 100%. ?
 
At my first service in July, they told me, after some chatting between them, that my SOH is 97.5%
Car Scanner told me 98% few weeks ago and I checked last week : it was 99%

Trophy, 22 kkm with 50 DC charging aproximatly
 
Thanks for all the replies.
Some points:

I agree that the SOH figure is not much use as an absolute number: My intention is to use it to monitor the change in SOH as time progresses. I did this with my previous car - a BMW i3 - and watched the capacity fall from 29.6 kWh to 24.4 kWh over the 4 years I owned it (falling off a cliff in the last 9 months - from 27.3 kWh).

Most of the issues raised in "context around the variability" disappear if the manufacturer provides the SOH figure in actual capacity (ie kWh) rather than % (as was pointed out - % of what?)

Using mileage achieved is not a reliable measure of capacity change. It depends on the nature of the terrain, traffic conditions, temperature, load carried as well as how it is being driven, for any particular test.

So, I have CarScanner and an ODB2 dongle. Since my car has only done 4000km, it is reporting 100% SOH. Has anyone been using CarScanner for long enough for it to register a fall in the reported SOH percentage? I just want to know if this is a reliable way to detect change in the SOH %.
I guess you are still losing from the upper buffer, so have 100% available.

Those of us with the LFP battery don't have much upper buffer, so we see the degradation very early. Hopefully the rate will tail off after the first year or so like it has for other EV models.
 
I'm seeing 97.5% on Car Scanner after 18 months and 11,000 miles (I know!).
On my SE I’m now seeing just over 95.5 after 13 months and 11k miles
Initially it was degrading by 0.01% every day, giving the battery pack was assembled sometime in April it seemed, but recently it has been degrading a little less each day, and occasionally when doing a full slow charge from 5 to 100% the number went up a little - took a picture can’t remember the actual number.
I think with LFP they apply a degradation of 0.01% daily, while occasionally recalibrating when a full charge is performed based on how many kWh go into the battery from near empty to full.
 
On the equivalent of Euro SE (51kWh) here I am seeing 95% after 1yr & 19k km. Car scanner pro & LE link.
Some figures on table are bs as mine shows 19000 mV delta? So I don't know whether 95% SOH is objective or what? Wish I could find individual cell voltages and access to SAIC BMS.
Amazed someone isn't cashing in with a decent app like leaf spy, but then you would need the SAIC API I guess.
 
Last edited by a moderator:
On the equivalent of Euro SE (51kWh) here I am seeing 95% after 1yr & 19k km. Car scanner pro & LE link.
Some figures on table are bs as mine shows 19000 mV delta? So I don't know whether 95% SOH is objective or what? Wish I could find individual cell voltages and access to SAIC BMS.
Amazed someone isn't cashing in with a decent app like leaf spy, but then you would need the SAIC API I guess.
I just asked a similar question on another thread, from what you are saying, the OBD only reports highest and lowest and the delta. It only takes a slight resistance in a connector to throw the delta way out, this is often seen when side by side cells show the highest and lowest readings, add them together and divide by 2 and you will see the reading are around the average of the other cells .... a bit tricky is it doesn't actually give you a reading of each cell ....

T1 Terry
 
from what you are saying, the OBD only reports highest and lowest and the delta. I
I'm 90% confident that individual cell voltages are available. Most apps don't display all the data as it's awkward to show 104 values with 4 significant digits, and most users just want the summary.

So it's a matter of finding the right app, or finding the right PIDs and interrogating the data yourself.
That makes sense. The BMS obviously needs to know cell voltages for balancing and protecting the cells. And it would make sense that MG can externally read that data for diagnostic purposes in case of cells failure etc.

Not sure how much use that info would be to an average user though, over and above the max-min data that is readily available?
Under load, a weak cell will show up instantly, a high resistance cell will show up when charging, a strange delta v figure can be traced to the problem area. All these things affect the battery operation, fast charging stops early if a cell shows signs of high resistance, the same for the remaining battery capacity, better to know and put the problem in writing to the dealership, than be told the battery is at 94% SOH when you know it isn't .....

T1 Terry
 
I agree that it will be in the BMS on the battery for balancing amongst others things, but whether it’s accessible on the CAN bus is another thing. I have yet to input a couple of PIDs from GitHub to learn a bit more. Also Car Scanner's (CS’s) profile is only “experimental“ at this stage I believe.
I am current waiting on my mg4 to hit 100 % and info centre is already contriving numbers that are not correct. Most frustrating!
CS has the API or has reverse engineered enough of it to get some data.
As for 104 data pts, leaf spy does it with aplomb so don’t subscribe to that.
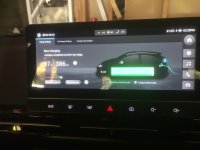
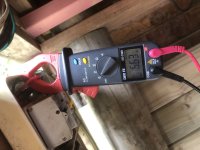
Point being below, info centre says power to battery has reduced from 1.4 kW to one kW yet clamp is still reading 6.6A. ( on granny charger of course)
Car scanner is next to useless here as parameter nomenclature is ambiguous and ridiculous for some values.
That my 3k$ setup in my boat's house bank is so much more user friendly than my 40k$ car
Rankles somewhat. Otherwise I love this car. (Maybe not the dealers)
It will be curious to see what amps it’s drawing when about to hit 100% soc. If we had access to data it would show how far into the “knee” 100% soc actually was . On the CV/diminishing current vs Time curve.
For those that “don’t need to know” , don’t read then. I won’t hold it against you. 😉
 

Attachments

  • IMG_2831.jpeg
    IMG_2831.jpeg
    285.3 KB · Views: 34
  • IMG_2832.jpeg
    IMG_2832.jpeg
    312.9 KB · Views: 32
Last edited by a moderator:

Are you enjoying your MG4?

  • Yes

    Votes: 910 77.7%
  • I'm in the middle

    Votes: 171 14.6%
  • No

    Votes: 90 7.7%
Support us by becoming a Premium Member

Latest MG EVs video

MG Hybrid+ EVs OVER-REVVING & more owner feedback
Subscribe to our YouTube channel
Back
Top Bottom